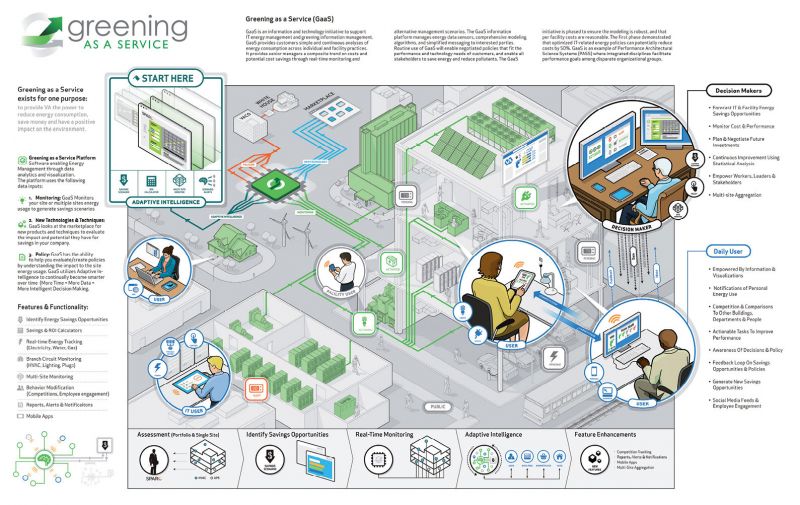
Ever wished you could show someone a complicated idea rather than explain it with words alone? When you’re an organization as complex as the U.S. Navy, clearly conveying engineering processes and managerial structures can be a challenge. Scott Williams, former deputy CIO at NAVAIR, discovered a solution as he helped coordinate the Navy’s supply of airplane parts and weapons: by translating their technical information into a graphic, he brought the puzzle together in a “big picture” manner that’s simple to understand.
That experience inspired Williams to found Maga Design, a consulting firm that helps clients analyze and streamline processes and then creates a visual map to explain them. Ten of the Washington, D.C.-based company’s 45 employees work from a satellite office in Mount Pleasant, established in 2011 to support Maga’s work with the Navy’s SPAWAR branch in North Charleston.
However, Maga doesn’t just work with the military. They’ve mapped PepsiCo’s production and supply chain process and helped the National Geographic Society better leverage relationships between editorial and sponsored researchers and explorers. Closer to home, they’ve created a pro-bono digital inventory and distribution map for the Lowcountry Food Bank.
Currently, Maga’s helping the U.S. Postal Service reinvent itself amidst an e-powered world. “We’re half management consulting, half visualization,” explains Rachel Link, Maga’s director of client services. “We’re helping them reimagine what the next generation of the USPS can provide to the American taxpayer.”
Keys to Success
Maga Design finds the sweet spot between corporate management and art, creating visuals that simplify complicated business relationships and processes. According to Rachel Link, a perfect Maga map contains three key factors:
➼ The human element: Computers now handle many jobs formerly done by people—an effective map emphasizes the importance of each employee’s role in the tech-based system.
➼ Humor: Business is about human relationships, which are stronger when the map’s tone is approachable and light-hearted.
➼ Whole-brain thinking: Use both quantitative and qualitative data and anecdotal storytelling techniques to communicate. “Leverage both sides of the brain to tell a comprehensive story that will resonate with many types of audiences,” says Link.